C言語からgnuplotでグラフを作成する方法を教えて!
こういった悩みにお答えします.
本記事の信頼性
- リアルタイムシステムの研究歴12年.
- 東大教員の時に,英語でOS(Linuxカーネル)の授業.
- 2012年9月~2013年8月にアメリカのノースカロライナ大学チャペルヒル校(UNC)コンピュータサイエンス学部で客員研究員として勤務.C言語でリアルタイムLinuxの研究開発.
- プログラミング歴15年以上,習得している言語: C/C++,Python,Solidity/Vyper,Java,Ruby,Go,Rust,D,HTML/CSS/JS/PHP,MATLAB,Verse(UEFN), Assembler (x64,aarch64).
- 東大教員の時に,C++言語で開発した「LLVMコンパイラの拡張」,C言語で開発した独自のリアルタイムOS「Mcube Kernel」をGitHubにオープンソースとして公開.
- 2020年1月~現在はアメリカのノースカロライナ州チャペルヒルにあるGuarantee Happiness LLCのCTOとしてECサイト開発やWeb/SNSマーケティングの業務.2022年6月~現在はアメリカのノースカロライナ州チャペルヒルにあるJapanese Tar Heel, Inc.のCEO兼CTO.
- 最近は自然言語処理AIとイーサリアムに関する有益な情報発信や,Unreal Editor for Fortnite(UEFN)でゲーム開発に従事.
- (AI全般を含む)自然言語処理AIの論文の日本語訳や,AIチャットボット(ChatGPT,Auto-GPT,Gemini(旧Bard)など)の記事を50本以上執筆.アメリカのサンフランシスコ(広義のシリコンバレー)の会社でChatGPT/Geminiを訓練するプロンプトエンジニア・マネージャー・Quality Assurance(QA)の業務委託の経験あり.
- (スマートコントラクトのプログラミングを含む)イーサリアムや仮想通貨全般の記事を200本以上執筆.イギリスのロンドンの会社で仮想通貨の英語の記事を日本語に翻訳する業務委託の経験あり.
- UEFNで10本以上のゲームを開発し,フォートナイト上で公開(Fortnite,Fortnite.GG).
こういった私から学べます.
C言語を独学で習得することは難しいです.
私にC言語の無料相談をしたいあなたは,公式LINE「ChishiroのC言語」の友だち追加をお願い致します.
私のキャパシティもあり,一定数に達したら終了しますので,今すぐ追加しましょう!
独学が難しいあなたは,元東大教員がおすすめするC言語を学べるオンラインプログラミングスクール5社で自分に合うスクールを見つけましょう.後悔はさせません!
目次
gnuplot
gnuplot(グニュープロット)とは,2次元または3次元のグラフを作成するためのソフトウェアです.
私が論文を執筆する時は,よくgnuplotを利用して数値解析したグラフを作成しています.
グラフはスクリプトを利用して作成しているので,ちょっとした修正はExcelよりも簡単にできます.
gnuplotの使い方を知りたいあなたは,以下のサイトがおすすめです.
Ubuntuでgnuplotをインストールする方法は以下になります.
|
1 |
$ sudo apt-get install gnuplot |
C言語からgnuplotでグラフ作成
C言語からgnuplotでグラフを作成する方法を紹介します.
具体的には,以下のpopen関数を利用します.
処理を終了する時はpclose関数を利用します.
|
1 2 |
FILE *popen(const char *command, const char *type); int pclose(FILE *stream); |
fopen/fclose関数の関係と似ていますね!
使い方もほぼ同様です.
gnuplotでsin関数のグラフ作成
gnuplotでsin関数のグラフを作成する方法を紹介します.
gnuplotの標準関数にあるsin関数
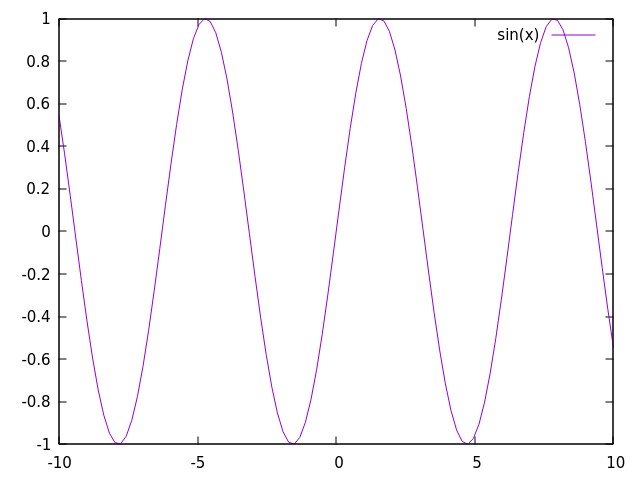
gnuplotの標準関数にあるsin関数でグラフを作成するコードは以下になります.
19行目の「plot sin(x)」でsin関数を作成します.
|
1 2 3 4 5 6 7 8 9 10 11 12 13 14 15 16 17 18 19 20 21 22 23 24 25 26 27 |
/* * Author: Hiroyuki Chishiro * License: 2-Clause BSD */ #include <stdio.h> #include <stdlib.h> #define GNUPLOT "gnuplot -persist" int main(void) { FILE *gp; if ((gp = popen(GNUPLOT, "w")) == NULL) { fprintf(stderr, "Error: cannot open \"%s\".\n", GNUPLOT); exit(1); } fprintf(gp, "plot sin(x)\n"); if (pclose(gp) == EOF) { fprintf(stderr, "Error: cannot close \"%s\".\n", GNUPLOT); exit(2); } return 0; } |
実行結果は以下になります.
CUI環境で実行するとエラーになりますので,GUI環境で実行しましょう.
|
1 2 |
$ gcc sin.c $ a.out |
作成したsin関数のグラフは以下になります.

C言語のプログラムで計算したsin関数の配列
C言語のプログラムで計算したsin関数の配列でグラフを作成するコードは以下になります.
calculate_sin関数でsin関数を計算して配列に格納しています.
40~42行目のfor文でsin関数のグラフを作成します.
|
1 2 3 4 5 6 7 8 9 10 11 12 13 14 15 16 17 18 19 20 21 22 23 24 25 26 27 28 29 30 31 32 33 34 35 36 37 38 39 40 41 42 43 44 45 46 47 48 49 50 51 |
/* * Author: Hiroyuki Chishiro * License: 2-Clause BSD */ #define _USE_MATH_DEFINES #include <stdio.h> #include <stdlib.h> #include <math.h> #define GNUPLOT "gnuplot -persist" #define NX 720 void calculate_sin(double x[NX + 1], double y[NX + 1]) { int i; double dx = (4 * M_PI) / NX; for (i = 0; i <= NX; i++) { x[i] = -2 * M_PI + i * dx; y[i] = sin(x[i]); } } int main(void) { FILE *gp; int i; double x[NX + 1], y[NX + 1]; calculate_sin(x, y); if ((gp = popen(GNUPLOT, "w")) == NULL) { fprintf(stderr, "Error: cannot open \"%s\".\n", GNUPLOT); exit(1); } fprintf(gp, "set xrange [%lf:%lf]\n", -2 * M_PI, 2 * M_PI); fprintf(gp, "set yrange [-1.0:1.0]\n"); fprintf(gp, "plot '-' with lines linetype 1 title \"sin(x)\"\n"); for (i = 0; i <= NX; i++) { fprintf(gp, "%f\t%f\n", x[i], y[i]); } if (pclose(gp) == EOF) { fprintf(stderr, "Error: cannot close \"%s\".\n", GNUPLOT); exit(2); } return 0; } |
実行結果は以下になります.
|
1 2 |
$ gcc sin2.c -lm $ a.out |
作成したsin関数のグラフは以下になります.(x軸は-2\(\pi\)~2\(\pi\)の間です.)

sin関数のデータファイルの読み込み
sin関数のデータファイルを読み込んでグラフを作成するコードは以下になります.
このcalculate_sin関数では,sin関数のデータファイルを作成します.
50行目のfprintf関数で作成したsin関数のデータファイルを読み込んでグラフを作成します.
|
1 2 3 4 5 6 7 8 9 10 11 12 13 14 15 16 17 18 19 20 21 22 23 24 25 26 27 28 29 30 31 32 33 34 35 36 37 38 39 40 41 42 43 44 45 46 47 48 49 50 51 52 53 54 55 56 57 58 59 |
/* * Author: Hiroyuki Chishiro * License: 2-Clause BSD */ #define _USE_MATH_DEFINES #include <stdio.h> #include <stdlib.h> #include <math.h> #define GNUPLOT "gnuplot -persist" #define NX 720 #define FILENAME "sin.dat" void calculate_sin(void) { FILE *fp; int i; double x, y; double dx = (4 * M_PI) / NX; if ((fp = fopen(FILENAME, "w")) == NULL) { fprintf(stderr, "Error: cannot open \"%s\".\n", FILENAME); exit(1); } for (i = 0; i <= NX; i++) { x = -2 * M_PI + i * dx; y = sin(x); fprintf(fp, "%lf\t%lf\n", x, y); } if (fclose(fp) == EOF) { fprintf(stderr, "Error: cannot close \"%s\".\n", FILENAME); exit(2); } } int main(void) { FILE *gp; calculate_sin(); if ((gp = popen(GNUPLOT, "w")) == NULL) { fprintf(stderr, "Error: cannot open \"%s\".\n", GNUPLOT); exit(3); } fprintf(gp, "set xrange [%lf:%lf]\n", -2 * M_PI, 2 * M_PI); fprintf(gp, "set yrange [-1.0:1.0]\n"); fprintf(gp, "plot \"%s\" with lines linetype 1 title \"sin(x)\"\n", FILENAME); if (pclose(gp) == EOF) { fprintf(stderr, "Error: cannot close \"%s\".\n", GNUPLOT); exit(4); } return 0; } |
実行結果は以下になります.グラフは「C言語のプログラムで計算したsin関数の配列」と同じなので省略します.
|
1 2 |
$ gcc sin3.c -lm $ a.out |
gnuplotでヒストグラムのグラフ作成
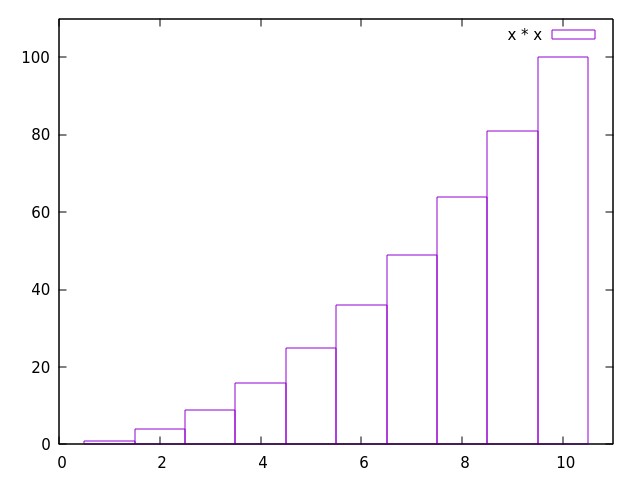
gnuplotでヒストグラムのグラフを作成するコードは以下になります.
ヒストグラムのグラフは,\(y = x^2\)となります.
|
1 2 3 4 5 6 7 8 9 10 11 12 13 14 15 16 17 18 19 20 21 22 23 24 25 26 27 28 29 30 31 32 33 34 35 36 37 38 39 40 41 42 |
/* * Author: Hiroyuki Chishiro * License: 2-Clause BSD */ #include <stdio.h> #include <stdlib.h> #define GNUPLOT "gnuplot -persist" #define N 10 int main(void) { FILE *gp; int x[N + 1]; int i; for (i = 0; i <= N; i++) { x[i] = i * i; } if ((gp = popen(GNUPLOT, "w")) == NULL) { fprintf(stderr, "Error: cannot open \"%s\".\n", GNUPLOT); exit(1); } fprintf(gp, "set boxwidth 1\n"); fprintf(gp, "set xrange [0:11]\n"); fprintf(gp, "set yrange [0:110]\n"); fprintf(gp, "plot '-' with boxes title \"x * x\"\n"); for (i = 0; i <= N; i++) { fprintf(gp, "%d\t%d\n", i, x[i]); } if (pclose(gp) == EOF) { fprintf(stderr, "Error: cannot close \"%s\".\n", GNUPLOT); exit(2); } return 0; } |
実行結果は以下になります.
|
1 2 |
$ gcc histgram.c $ a.out |
ヒストグラムは以下になります.

応用:VEEの問題をgnuplotで解いてみた
VEEとは,2021年よりSony Musicが開始した史上最大規模のバーチャルタレント育成&マネジメントプロジェクトです.
VEEの広告で以下の問題を発見しました.

問題の数式は以下になります.
$$x^2 + (y - \sqrt[3]{x^2})^2 = 1$$
yで解くと下式になります.
$$y = \sqrt[3]{x^2} \pm \sqrt{1 - x^2}\ \ \ (-1 \leq x \leq 1)$$
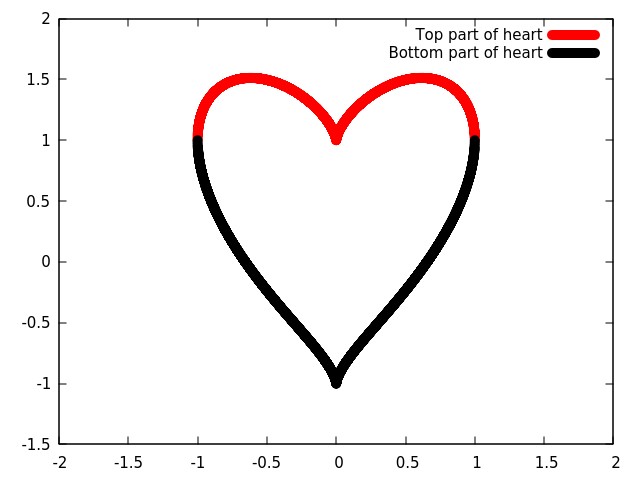
上記のVEEの問題をgnuplotで解いてみました.
コードは以下になります.
27~30行目のfor文で,pow/sqrt関数を利用してyの値を計算しています.
|
1 2 3 4 5 6 7 8 9 10 11 12 13 14 15 16 17 18 19 20 21 22 23 24 25 26 27 28 29 30 31 32 33 34 35 36 37 38 39 40 41 42 43 44 45 46 47 48 49 50 51 52 53 54 55 56 57 58 59 60 61 62 63 64 65 |
/* * Author: Hiroyuki Chishiro * License: 2-Clause BSD */ #include <stdio.h> #include <stdlib.h> #include <math.h> #define GNUPLOT "gnuplot -persist" #define XMIN -1.0 #define XMAX 1.0 #define OFFSET 0.0001 #define FILENAME "heart.dat" void calculate_heart(void) { FILE *fp; double x; printf("x^2 + (y - \\sqrt[3]{x^2})^2 = 1\n"); if ((fp = fopen(FILENAME, "w")) == NULL) { fprintf(stderr, "Error: cannot open \"%s\".\n", FILENAME); exit(1); } for (x = XMIN; x <= XMAX; x += OFFSET) { fprintf(fp, "%lf\t%lf\t%lf\n", x, pow(x * x, 1.0 / 3.0) + sqrt(1 - x * x), pow(x * x, 1.0 / 3.0) - sqrt(1 - x * x)); } if (fclose(fp) == EOF) { fprintf(stderr, "Error: cannot close \"%s\".\n", FILENAME); exit(2); } } int main(void) { FILE *gp; calculate_heart(); if ((gp = popen(GNUPLOT, "w")) == NULL) { fprintf(stderr, "Error: cannot open \"%s\".\n", GNUPLOT); exit(3); } fprintf(gp, "set xrange [-2.0:2.0]\n"); fprintf(gp, "set yrange [-1.5:2.0]\n"); fprintf(gp, "plot \"%s\" using 1:2 with lines lw 10 lc \"red\" title \"Top part of heart\"\n", FILENAME); fprintf(gp, "replot \"%s\" using 1:3 with lines lw 10 lc \"black\" title \"Bottom part of heart\"\n", FILENAME); if (pclose(gp) == EOF) { fprintf(stderr, "Error: cannot close \"%s\".\n", GNUPLOT); exit(4); } return 0; } |
実行結果は以下になります.
|
1 2 |
$ gcc heart.c -lm $ a.out |
大事なのはハートです!

pow/sqrt関数を知りたいあなたはこちらからどうぞ.
まとめ
C言語からgnuplotでグラフを作成する方法を紹介しました.
具体的には,sin関数とヒストグラムのグラフを作成しました.
応用としてVEEの問題をgnuplotで解いてみました.
C言語を独学で習得することは難しいです.
私にC言語の無料相談をしたいあなたは,公式LINE「ChishiroのC言語」の友だち追加をお願い致します.
私のキャパシティもあり,一定数に達したら終了しますので,今すぐ追加しましょう!
独学が難しいあなたは,元東大教員がおすすめするC言語を学べるオンラインプログラミングスクール5社で自分に合うスクールを見つけましょう.後悔はさせません!


